


TL;DR
|
Colocation quotes can be built in three shapes. One prices a rack with power included. Another prices committed kilowatts (kW). A third charges for space and then meters the energy your servers use.
A headline rate does not show which quote costs less for a given load. This guide quotes no prices. Instead, it sets out a method to put every quote on one basis, with hypothetical numbers you can replace with your own.
The method builds on our colocation provider evaluation checklist, which covers power design, service level agreements (SLAs) and the full recurring charge schedule. Here the focus is narrower: the power line of each quote, and what it actually buys. It is written for CIOs, procurement leads and artificial intelligence (AI) infrastructure teams placing enterprise or graphics processing unit (GPU) racks in India.
Colocation Pricing Models: Per kW vs Per Rack vs Metered Power
The three structures differ in what the monthly charge is tied to. In a per-rack quote, the charge follows the cabinet, with power included up to a stated kW or circuit. With committed kW, you pay for a reserved block of power whether you draw it or not. Under metering, part of the bill follows measured energy in kilowatt-hours (kWh).
A quote can also mix these. For example, a committed block may come with metered energy on top. The table below separates the parts so that each line can be read on its own.
| Structure | What the fixed charge buys | What varies each month | What to verify |
|---|---|---|---|
| Per rack (power bundled) | Cabinet space plus power up to an included kW or circuit | Charges above the inclusion, if the contract defines any | Included kW, circuit rating per feed, the rule above the inclusion |
| Committed kW | A reserved block of kW, billed in full every month | Overage above the commitment | Commit size, overage basis, measurement interval, step-up terms |
| Metered power | Space and circuits | Energy in kWh, with any multiplier the contract sets | Meter location, multiplier basis, billing period |
| Hybrid (commit plus metered energy) | A reserved block of kW | Energy drawn within or above the block | Whether the same kW appears in both lines |
Sources: quote structures as defined in this guide; tariff logic from the Chhattisgarh State Electricity Regulatory Commission (CSERC) tariff schedule linked below.
Reading across each row comes before comparing any price. Two quotes with the same headline can buy different things, because one may include energy and the other may not. The last column holds the evidence that turns a headline into a comparable number.
How one Indian electricity tariff mirrors these lines
The Chhattisgarh tariff schedule follows a similar two-part logic. Its FY 2025-26 schedule makes the demand charge a monthly minimum charge, payable whether any energy is consumed or not, with a separate energy charge per unit. A committed kW line resembles that demand charge, and a metered line resembles the energy charge. So it is fair to ask each provider which of its own utility costs sit in which line of your quote.
Putting Colocation Quotes on One Basis: Cost per Usable kW
The method converts each quote into two numbers: cost per usable kW and cost per drawn kW. Usable kW is the power a rack position can take continuously, after circuit limits and redundancy. Drawn kW is your measured or forecast average load. The second number shows what you pay for the load you actually run.
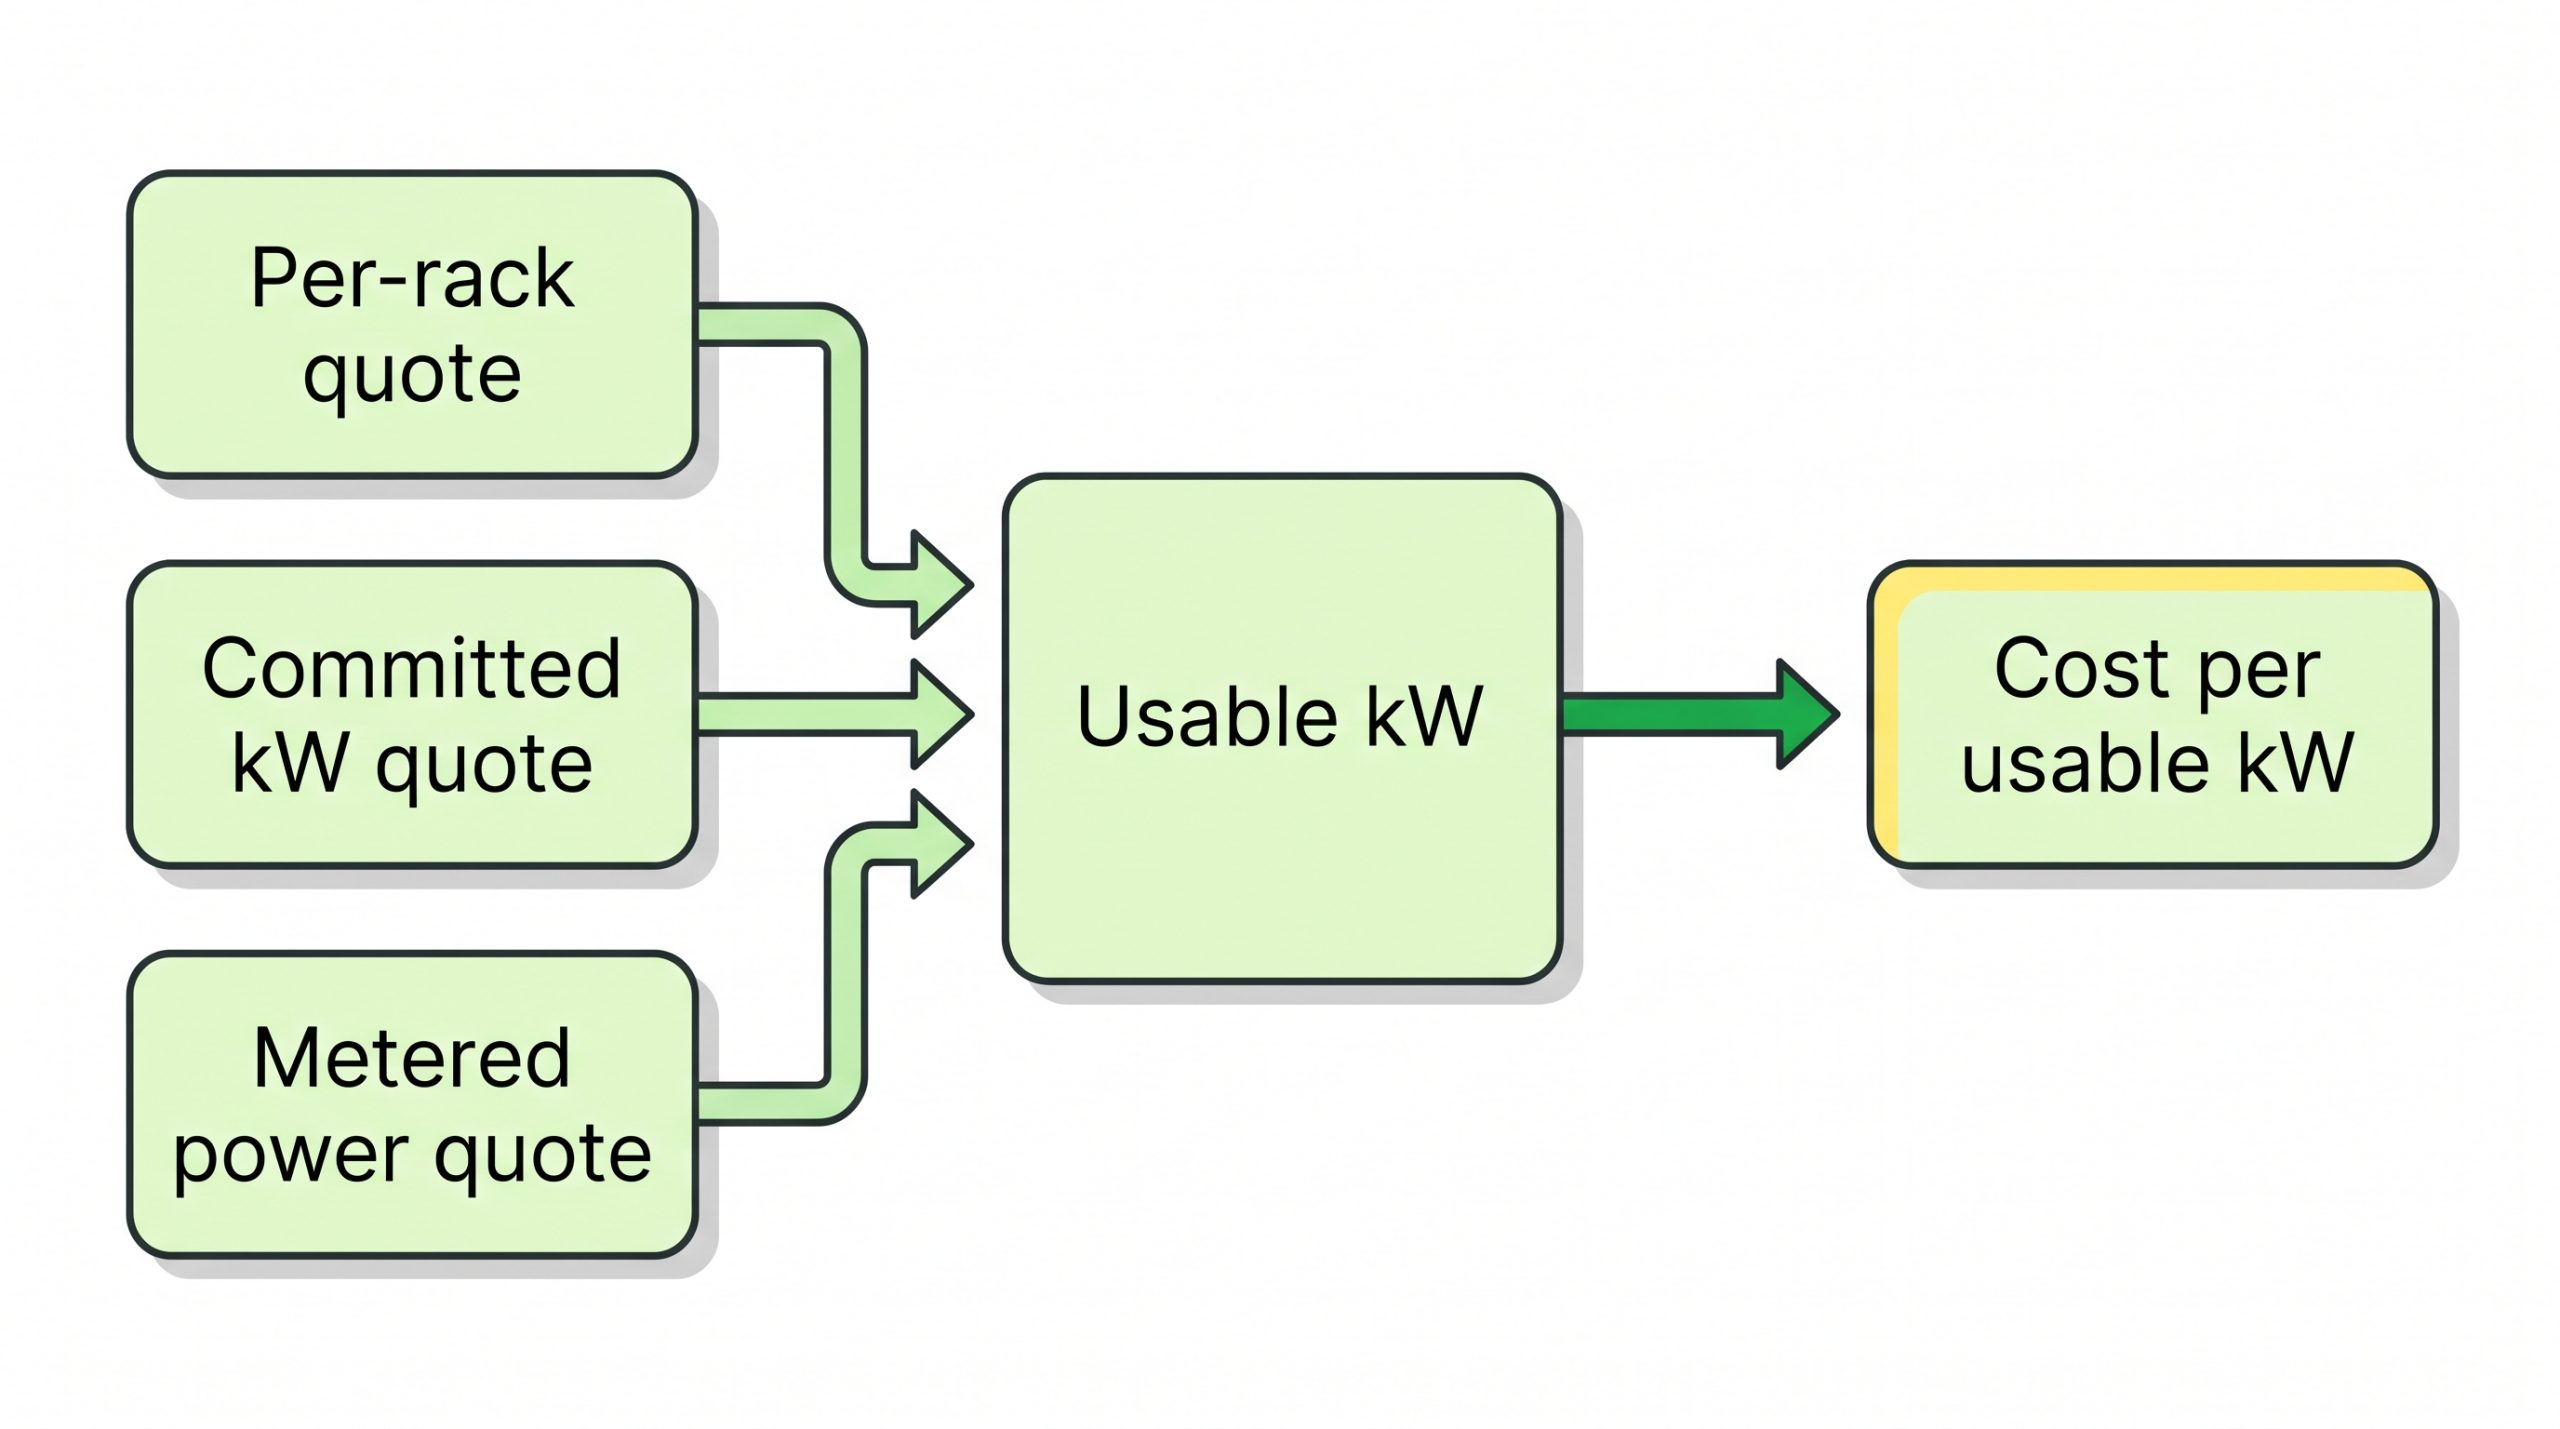
Figure 1. Each quote, whether per-rack, committed kW or metered, is first reduced to usable kW and then to cost per usable kW, so all three can sit in one comparison table.
Step 1: Find the usable kW in each quote
Usable kW is the smallest of four limits. It fits a simple formula, with one line per quote.
Usable kW = the lowest of (contracted or included kW, continuous circuit kW, single-feed kW on A+B, cooled kW per position)
The circuit limit depends on the electrical standard. For North American installations, Schneider Electric notes that UL (Underwriters Laboratories) has mandated derating rack power distribution unit (PDU) components to 80 percent continuous load. By contrast, the Raritan iPDU Handbook circuit table lists international 230 V, 32 A circuits at the full 32 A, giving 7.4 kW.
The same table lists 400 V three-phase 32 A circuits at 22.2 kW. Which derating rule does the facility apply to your circuits, and is that answer in writing?
Redundancy sets the next limit. Raritan’s handbook describes a North American dual-feed rack with two PDUs each loaded to 40 percent, so that if one feed fails, the other does not exceed the 80 percent derated current limit that applies there. In that design, the two feeds together carry no more than the derated current of one feed. Is the quoted kW stated per feed or for both feeds together?
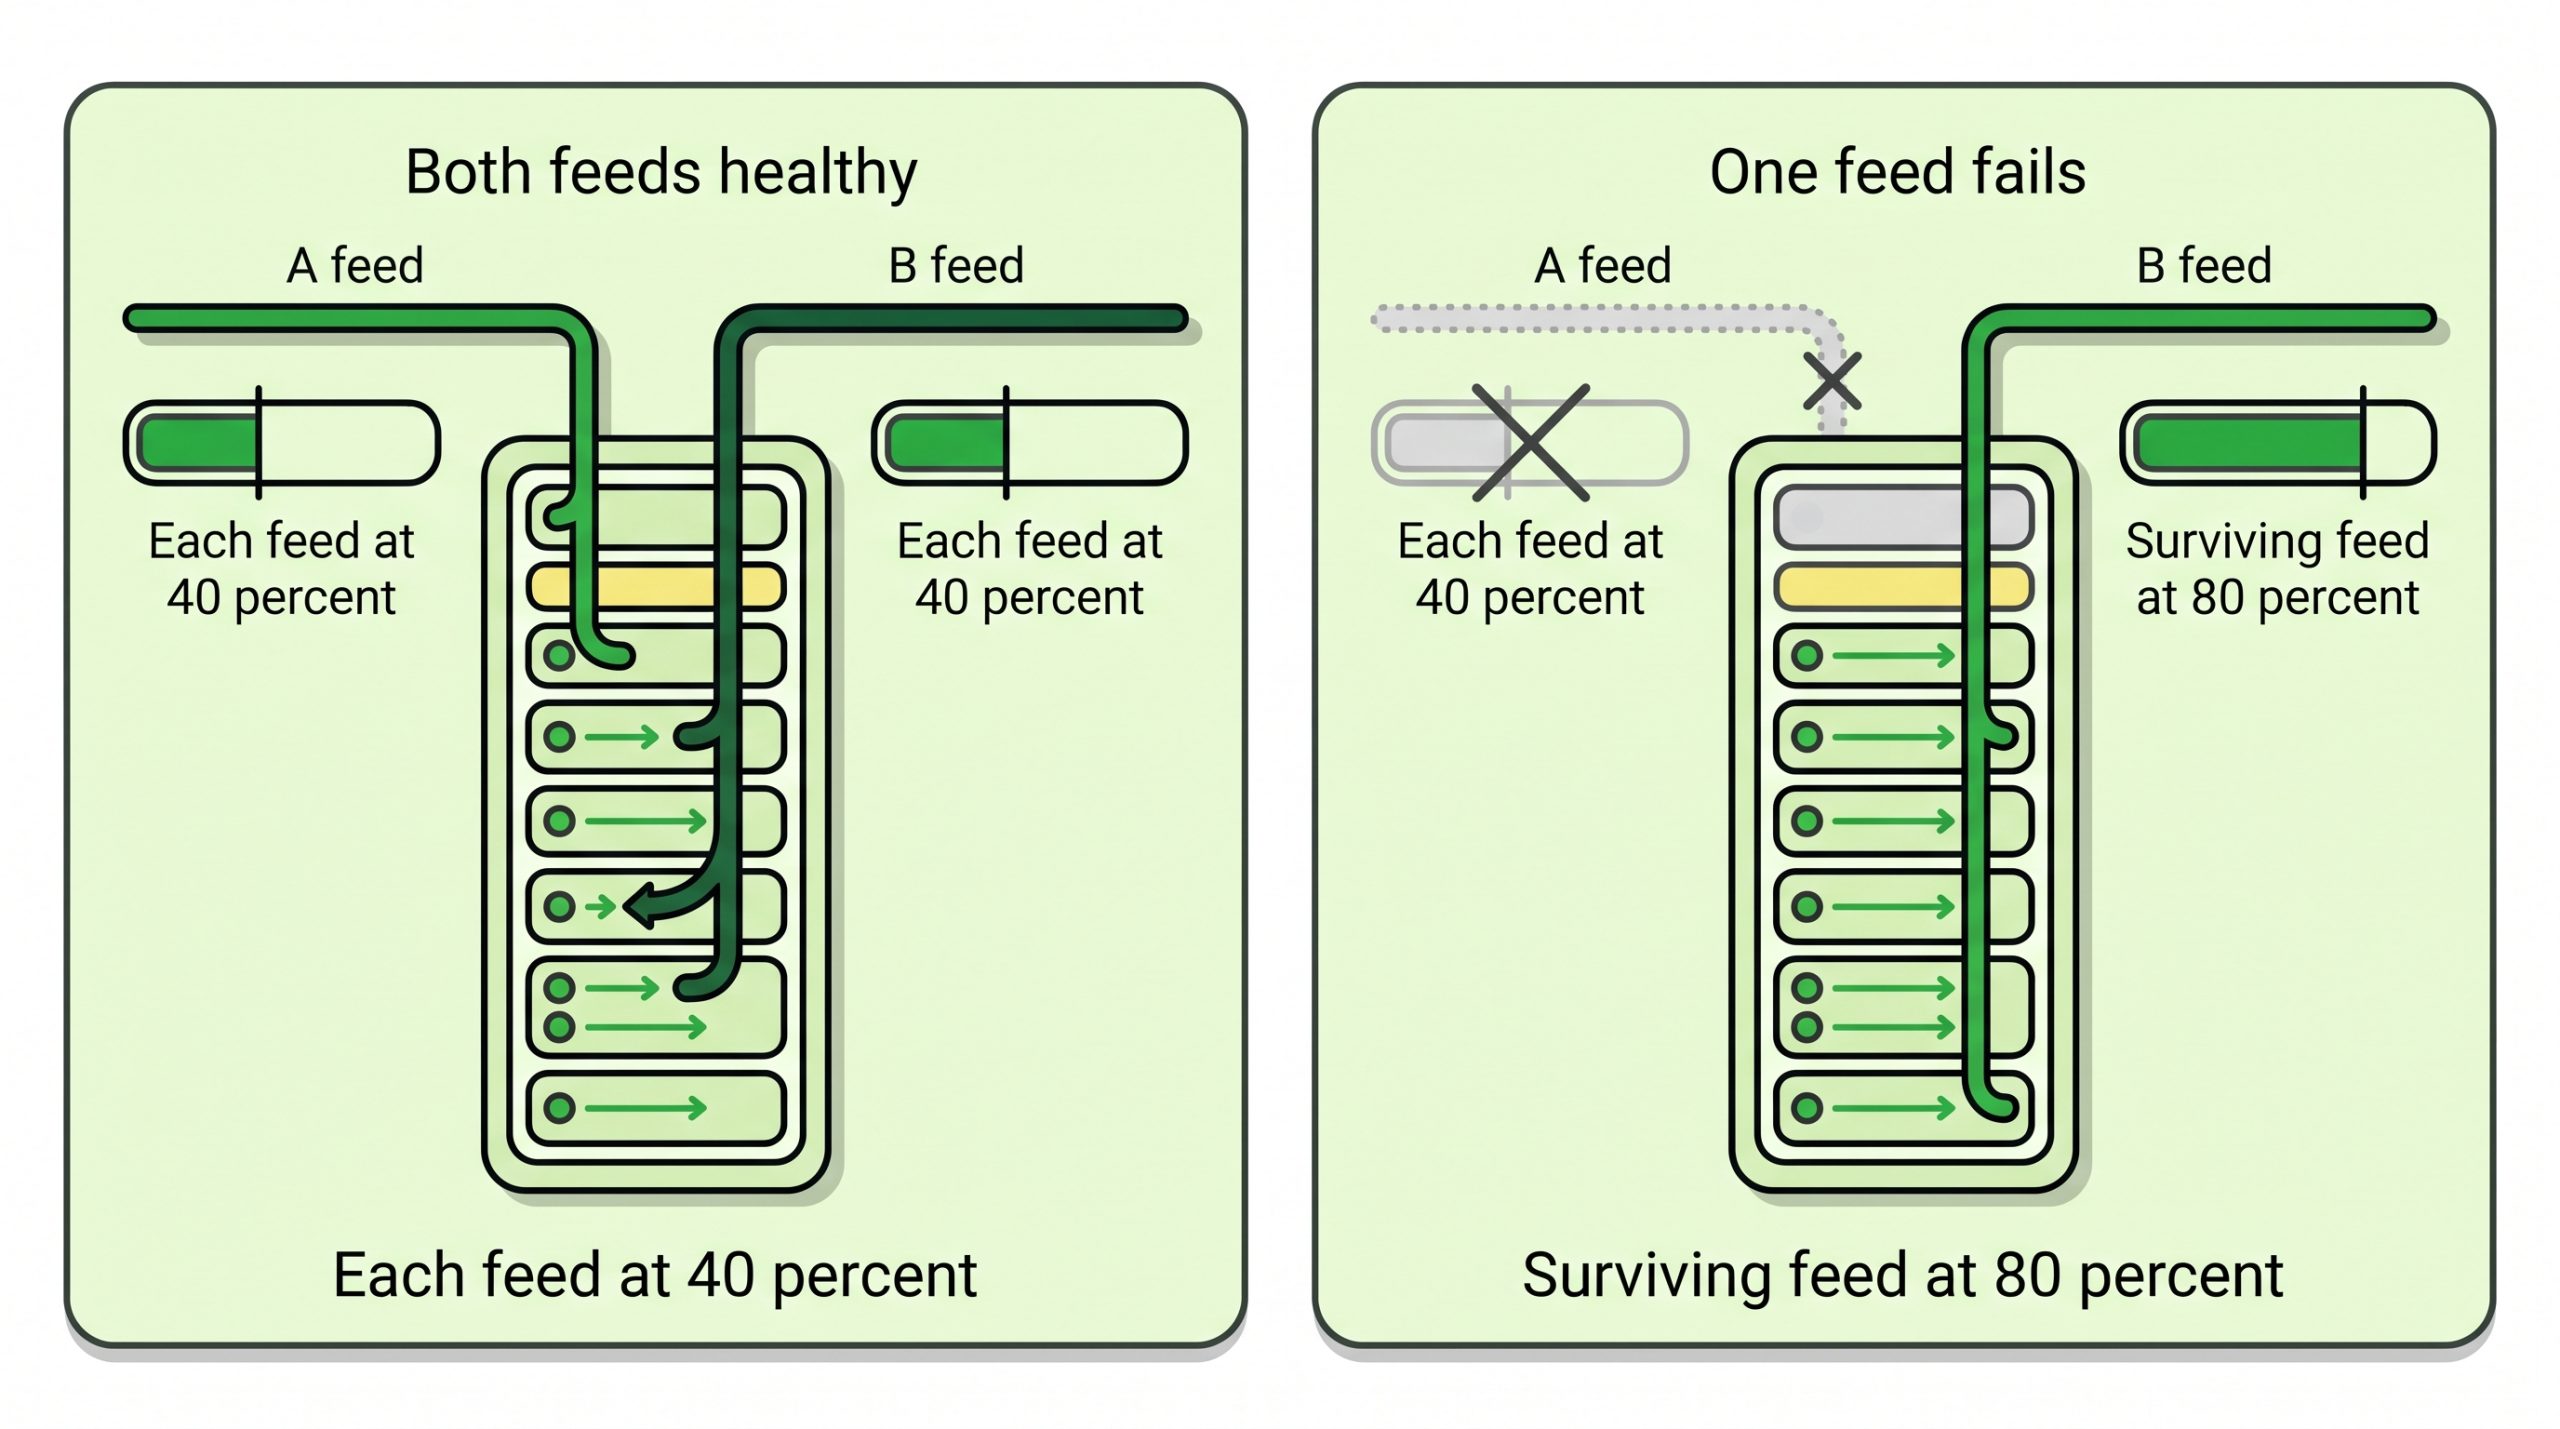
Figure 2. In the North American example from Raritan’s handbook, each feed runs at 40 percent so that the surviving feed stays at 80 percent after a failure. In that design, usable kW is what one feed carries alone.
For example, NVIDIA lists the DGX B200 at about 14.3 kW maximum system power in a 10 RU chassis, where RU means rack units. Two such systems in one rack can peak near 28.6 kW. A per-rack package built on one 230 V, 32 A feed per side, at 7.4 kW usable, could not host even one of them.
Step 2: Add every power-related charge
Next, total the monthly charges that move with power. The draw figure here is the forecast average, not the nameplate figure.
Monthly power cost = fixed charges + overage charges + (kWh x energy rate x multiplier)
kWh per month = average drawn kW x 730 hours (8,760 hours in a year divided by 12)
The Green Grid defines power usage effectiveness (PUE) as the ratio of total facility energy to IT equipment energy. If a metered quote applies a PUE-style factor to your kWh, is it a fixed number, a design value or a measured one?
Over which period is the factor measured? A fixed factor and a measured one can produce different bills from the same load.
Step 3: Divide by the kW you will actually draw
Cost per drawn kW = monthly power cost / average drawn kW
The calculation can run at three loads: a low month, an expected month and a peak month. The table below uses hypothetical price units (PU), not market prices, for three quotes on the same rack.
| Quote (hypothetical) | Terms | Usable kW | PU per drawn kW at 3 kW | At 6 kW | At 9 kW |
|---|---|---|---|---|---|
| A: per rack | 150 PU a month, power included, one 230 V 32 A feed per side | 7.4 | 50.0 | 25.0 | Does not fit |
| B: committed kW | 10 kW at 20 PU per kW, energy assumed included in that rate, overage above 10 kW | 10 | 66.7 | 33.3 | 22.2 |
| C: metered | 60 PU for space and circuits, 0.015 PU per kWh, multiplier 1.4, one 400 V three-phase 32 A feed per side | 22.2 | 35.3 | 25.3 | 22.0 |
Sources: hypothetical price units for illustration only; quote B assumes energy is included in its 20 PU per kW. Usable kW figures from the Raritan iPDU Handbook circuit table. Hours per month calculated as 8,760 / 12.
No quote wins at every load in this example. Option A is lowest at 6 kW but cannot carry 9 kW on its circuits. Option B costs most at low draw and becomes competitive only as draw nears its commitment.
By contrast, quote C is lowest at 3 kW and 9 kW, but only while its multiplier and energy rate stay as quoted. Your numbers will differ; the point is that the ranking can change with load.
WHAT TO VERIFY
|
Which Pricing Model Fits Enterprise, GPU and Standby Racks
Last updated: 08 Nov 2026
Uptime Institute’s 2026 Global Data Center Survey found the average modal rack density passed 11 kW, up from 9 kW in 2025. The same survey says 4 to 5 kW remains the most common rack density in deployment.
Uptime treats 30 kW as the lower bound of high density. At the top end, 24 percent of respondents have some racks at 30 kW or above, up from 19 percent in 2025. The survey also notes rising pressure to make the most of contracted power in colocation sites.
Four deployment scenarios
Each scenario below applies the three-step method to a common deployment.
- Enterprise resource planning (ERP) or database racks with steady, low draw. A per-rack package fits when peak draw stays below the single-feed usable kW. Does that headroom survive your next hardware refresh?
- GPU training racks running near constant load. A committed kW quote fits when the commitment sits close to measured average draw, because cost per drawn kW falls as draw approaches the commitment. Is the commitment sized from measured draw or from nameplate maximums?
- Inference pilots that ramp over several months. A metered quote, or a small commitment with defined step-ups, can keep the fixed share low while draw is uncertain. How much notice does a step-up need, and is its rate fixed at signature?
- Disaster recovery (DR) racks that idle most of the month. Low average draw pushes cost per drawn kW up on any fixed structure. A metered quote tracks that low draw, provided the space and circuit charges stay small.
Rack-ready position or custom fit-out
Uptime notes that data centres have centred on the 4 to 5 kW design range for more than a decade. For racks near that band, does a standard position cover peak draw on one feed? For racks approaching 30 kW, such as two DGX B200 systems, does the provider offer that density as a rack-ready position or as a custom fit-out with its own lead time and charges?
The signs that racks have outgrown a standard hall are set out in five signs your AI infrastructure has outgrown traditional colocation. If the open question is still whether AI workloads belong in colocation at all, our post on migrating AI workloads to colocation covers that decision.
Supply in India is also changing. Cushman & Wakefield reports that India’s operational data centre capacity reached nearly 1.8 GW in H1 2026, with a pipeline of nearly 3.9 GW. With capacity spread across many sites, is the quoted density and power term stated for the hall you will occupy? Our guide to India colocation cities and provider types covers how sites differ beyond price.
Where this method stops
Cost per drawn kW covers the power line only. It leaves out cross-connects, remote hands, escalation clauses and exit terms, which the evaluation checklist covers.
The method also assumes your load forecast holds. Has the comparison been rerun since the last forecast change? Finally, it cannot rank a quote whose circuit, overage or multiplier terms the provider will not put in writing.
| Criterion | Why it matters | What to verify |
|---|---|---|
| Usable kW | Sets what the rack can run continuously | Circuit rating, derating rule, single-feed limit, cooling limit |
| Committed kW | Billed in full whatever the draw | Commit size against measured average draw |
| Overage | Prices draw above the commitment | Measurement method and interval, rate basis |
| Metered energy | Moves the bill with load | Meter location, billing period, multiplier basis |
| A+B feeds | Set redundancy and can cap usable kW | Whether kW is stated per feed or per rack |
| Density fit | Decides rack-ready position or fit-out | Highest density in live operation in your hall |
| Cost per drawn kW | Puts all quotes on one basis | Results at low, expected and peak load |
Choosing a Quote Structure: The Takeaway
A headline rate says little about the cost of your load. The method reduces each quote to usable kW, adds every power-related charge and divides by the kW you will actually draw. The results are then compared at low, expected and peak load.
Two check questions show when the method is worth running. Do the quotes arrive in different shapes? Do GPU racks push past standard circuits?
If both answers are no, the line items may already compare directly. In every case, the method does not replace the wider evaluation of power design, SLAs and exit terms.
| NEXT STEP Your load profile and the WHAT TO VERIFY list above can anchor a conversation about RackBank colocation services, so that our quote sits on the same cost per drawn kW basis as the others. |
FAQs
Can a per-rack colocation contract be switched to committed kW later?
The signed contract decides whether and when a switch can happen. The clauses to check are whether a change is allowed mid-term or only at renewal, and with what notice. Is the new commitment set from the rack’s measured draw rather than nameplate maximums?
Do A and B power feeds double the kW available to a rack?
Not in the dual-feed design Raritan describes. There, each feed is loaded to no more than 40 percent of its rating, so that one feed can carry the rack alone. Does a quote with two 7.4 kW feeds give 7.4 kW of usable load or 14.8 kW?
How is overage measured on a committed kW contract?
Each contract sets its own method, so the first check is whether that method is stated in writing. The interval matters: the CSERC tariff schedule measures maximum demand over 15 minutes for its high-voltage category HV-1, railway traction, and over 30 minutes for its low-voltage demand-based tariffs. Would a short peak count under a 15 minute window but average out under a 30 minute one?
Is per-rack colocation pricing suitable for GPU servers?
Only if the included power covers the server’s peak on one feed. A single 8-GPU system can exceed what one single-phase 32 A circuit delivers, as the DGX B200 example shows.
What does an audit of a PUE multiplier on a colocation bill involve?
The Green Grid defines PUE as total facility energy divided by IT equipment energy, so an audit needs both readings. Which meters supply each figure, and over what period are they read? Is the factor on the bill the measured value for that period, or a number fixed at signature?


